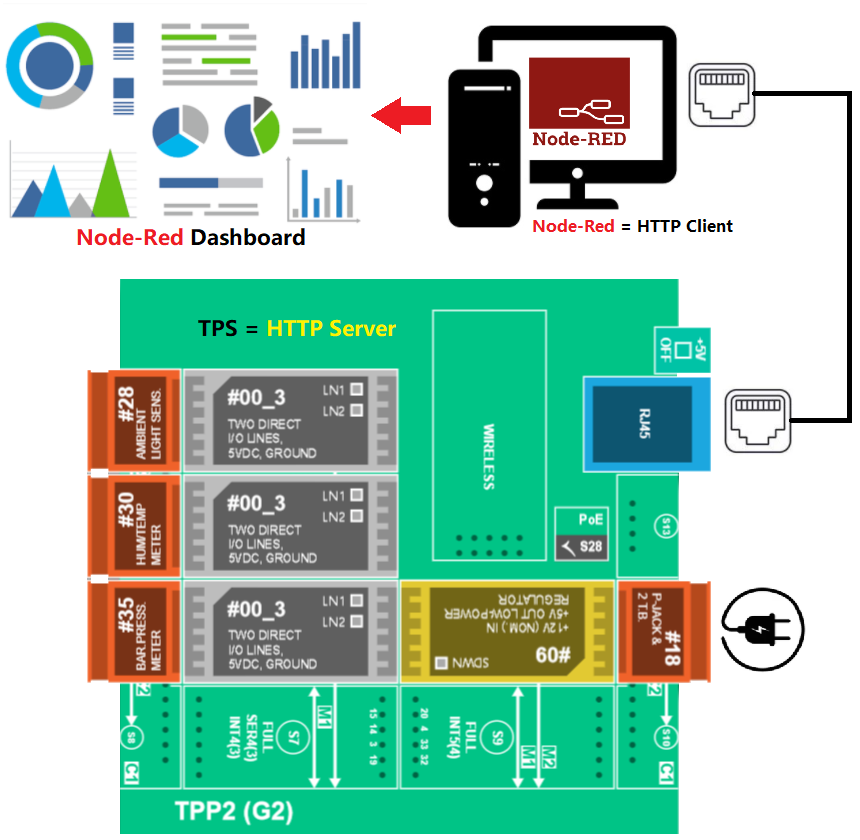
Node-RED Dashboard (3-TPS Sensors)
Hardware Requirements:
TPS-G2 board
Sensor Tibbit #28, #30, #35
IO Tibbit #00_1 and #00_3(3)
Power Tibbit #09 and #18
Router for Network LAN
Software Requirements:
TPP2-G2 TiOS firmware (3.80.18)
TDST (Tibbo Device Server Toolkit)
TIDE (Tibbo Integrated Development Environment)
Virtual Machine Node-RED installed (Virtual Box)
Additional modules in Node-RED “Dashboard”
Project steps:
- Install Node-RED in VM and add additional modules like “Dashboard”
- Upload the TiOS firmware in TPP2G2 board
- Download the basic project from CODY
- Add logic to your project using TIDE
- Create the flow in Node-RED
Steps:
Install Node-RED in VM and add additional modules like “Dashboard”
To install Node-RED on a Linux machine you need to have node.js support
sudo npm install -g --unsafe-perm node-red
npm install node-red-dashboard
More information on the web links below:
https://nodered.org/docs/getting-started/local
https://flows.nodered.org/node/node-red-dashboard
Upload the TiOS firmware in TPP2G2 board
You can download the TDST and TPP2G2 firmware from the Tibbo website, weblink is shared below
https://tibbo.com/downloads.html
Install the TDST on your PC and access Device Explorer to get the visibility of the Tibbo devices in your LAN.
Add the Tibbits to the TPP2G2 board on the respective sockets.
Connect the TPP2G2 board to LAN and power the board.
To upload the firmware, click on “Upload” and use the LAN network to transfer the file.

Download the basic project from CODY
Use CODY to build the configuration and download the project to your PC
Enable DHCP or keep the IP static as per your requirements on the Ethernet connection

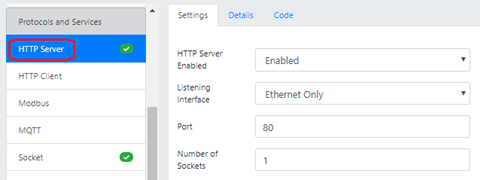
Enable HTTP Server feature, as we will be using HTTP socket to transfer the sensor values to Node-RED
Enable Socket library feature to add socket which can be used for other purposes. HTTP socket is different from this socket. CODY already has taken care of assigning HTTP socket for all HTML pages.
Chose the respective parameters like listening port, Interface to be used (WIFI/Ethernet) and protocol as per your requirements.


Add logic to your project using TIDE
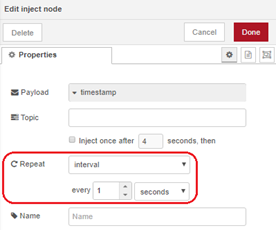
Assign the variable to sensor values and increase the system timer to 2 seconds, as Node-RED will pull the sensor values using HTTP socket, so 2 seconds will give Node-RED enough time to get the values without timing out the requests.
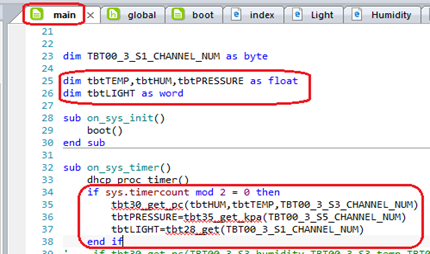

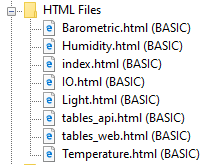
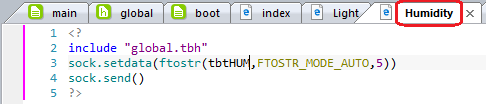
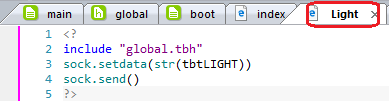
Create new HTML pages to transfer the sensor data to Node-RED on HTTP socket, make sure the data type is correct (String), and use the conversion while sending the data on the socket.
HTTP socket selection will happen automatically as CODY will take care of it.
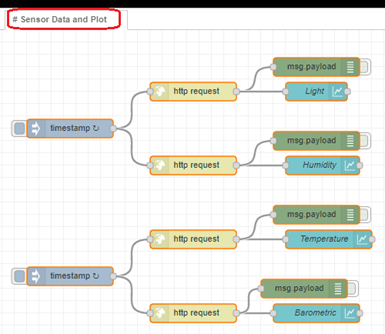
Create the flow in Node-RED
Access the Node-RED in Chrome using the VM IP (http://VM-IP:1880) and port 1880.
The dashboard is accessed by adding "/ui" (http://VM-IP:1880/ui)
You will need the nodes like “Inject”, “HTTP request”, “Chart” and “debug”.
You might not require the “debug” node, but I used to check whether I am getting the correct sensor values in Node-RED before plotting it on the graph.
You can remove the “debug” node after all is set.
“Inject” node properties:
“HTTP request” node properties:
Input the URL of the TPP2G2 device (DHCP/Static) in the respective properties to connect.
Enable the keep-alive function for connectivity, I didn’t use the authentication, proxy, and secure (SSL/TLS) connection for simplicity of demonstration.

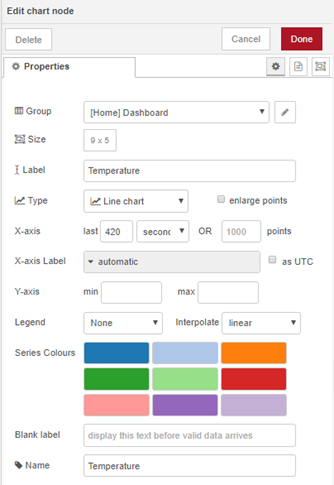
“Chart” node properties:
Before changing the properties in the “Chart” node, you need to create the tabs in Dashboard and name it accordingly, then you can select the type of chart you need as your representation, select the size of the chart and denote the X-axis and Y-axis parameters.
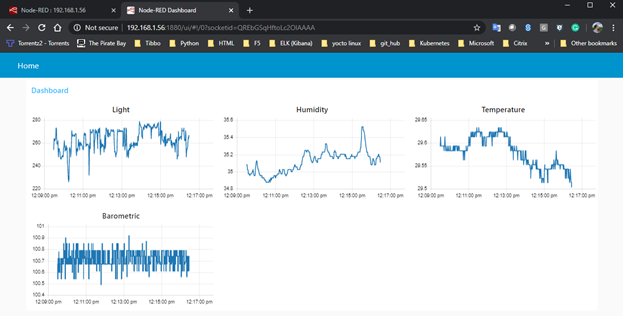
Results of the Project:
Comments
0 comments
Please sign in to leave a comment.